Have you ever struggled with a messy spreadsheet in Excel? Data all over the place, hard to sort, and formulas breaking whenever you insert a new row?
Imagine a magic button that transforms your data into a neat and tidy table, complete with fancy formatting, automatic sorting and filtering, and formulas that magically adjust as your data grows. That’s the power of Excel Tables, a hidden gem most people miss! They’re like superheroes for your spreadsheets, making data organization and analysis a breeze. Let’s unlock the true potential of your spreadsheets! and learn how to use Excel Table like a pro.
What is Excel Table?
Regular data ranges in Excel are simply blocks of cells containing information. They can be great for basic tasks, but when your data gets more complex, things can get complicated. Here’s where Excel tables come in!
Excel table is like a superhero for your data. It takes a regular data range and transforms it into a structured format, offering a bunch of cool features to make your life easier.
Here’s the key difference:
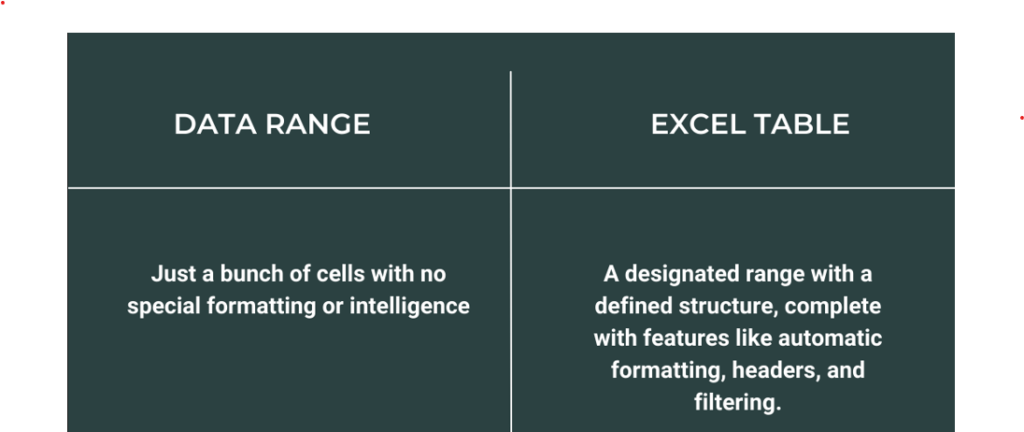
Think of it like this: Imagine your data is a pile of clothes. A regular data range is just leaving them on the floor. An Excel table is like neatly folding them, putting them in drawers, and labeling them for easy access.
Benefits of Using Excel Tables
Here are some of the key benefits that make Excel Table an excellent tool for your spreadsheets:
Organization & Formatting on Autopilot
No more manually formatting each cell! Excel tables automatically apply clean and consistent formatting, making your data look sharp and improving readability.
Sorting & Filtering Like a Boss
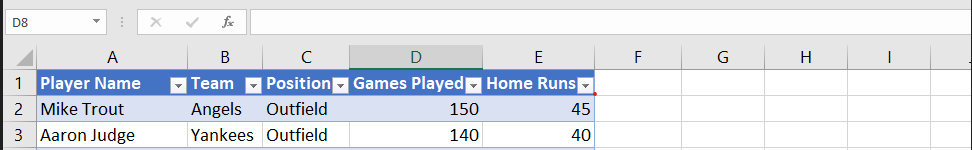
Forget clunky sorting and filtering techniques. Excel tables come with built-in filter arrows on each header. Simply click and choose to instantly focus on specific data points you need.
Headers That Never Get Lost
Say goodbye to scrolling up and down to remember what data goes where. Excel tables lock headers in place, so you always know what information you’re working with. Filtering arrows are right there too, for ultimate convenience.
Formula Fun with Calculated Columns
Need to crunch numbers based on existing data? Excel tables let you create calculated columns with formulas. Simply write your formula once, and it automatically applies to all rows, saving you tons of time and reducing the risk of errors.
Effortless Totals with a Built-in Row
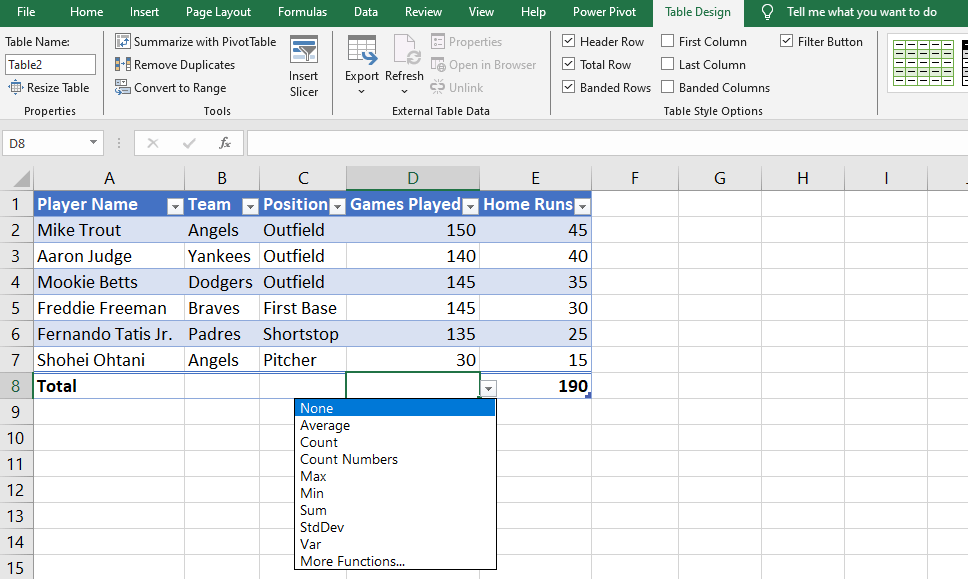
Are you tired of manually adding up rows and columns? Excel tables come with a built-in totals row that automatically calculates sums, averages, or other functions you specify. No more tedious calculations, just instant insights.
Growing Data, No Problem
As your data expands, Excel tables automatically resize to accommodate it. No need to worry about formulas breaking or formatting going haywire. Your table simply adjusts seamlessly, keeping everything organized and functional.
How to Create a Table in Excel
To create a table in Excel, follow these 5 simple steps:
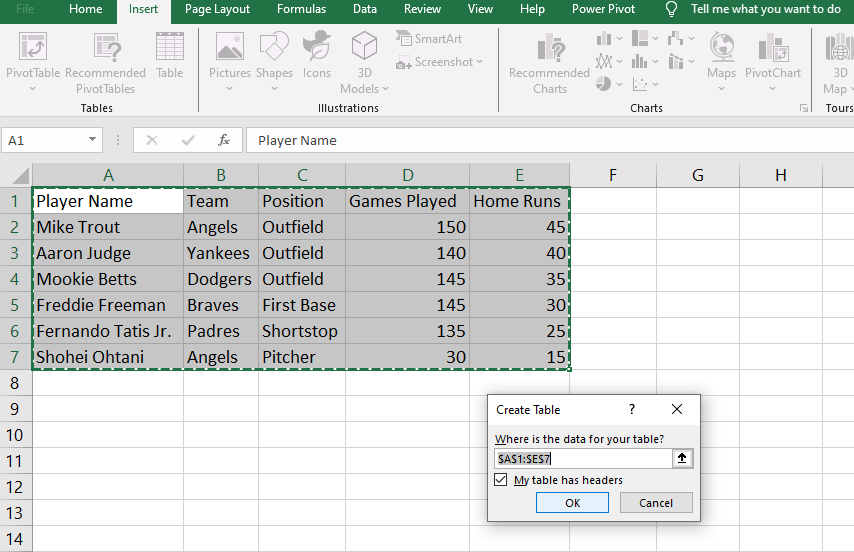
- Step-1 Select the range of data you want to convert into a table.
- Step-2 Navigate to the “Insert” tab in the Excel ribbon.
- Step-3 Click on the “Table” option.
- Step-4 Confirm the range of data and ensure the “My table has headers” checkbox is checked.
- Step-5 Click “OK” to create the table.
PRO TIP: CTRL+T is the shortcut key for creating a table. So, just select the range of data and press CTRL+T to create your data table.
How to Name a Table in Excel
To give a meaningful name to an Excel table, follow these steps:
- Click anywhere within the table.
- Go to the “Table Design” tab.
- In the “Properties” group, enter the desired name in the “Table Name” field.
How to Remove Table Formatting in Excel
If you wish to remove table formatting in Excel while retaining the data, follow these steps:
- Select any cell within the table.
- Go to the “Table Design” tab.
- Click on the “Convert to Range” option.
- Confirm the action by clicking “Yes.”
How to Insert an Excel Table into Word
To insert an Excel table into a Word document as an embedded object, follow these steps:
- Select the entire table in Excel.
- Right-click on the selected table and choose “Copy.”
- Switch to Microsoft Word.
- Place your cursor where you want to insert the table.
- Right-click and select “Paste Special.”
- Choose “Microsoft Excel Worksheet Object” and click “OK.”
How to Convert a Table to a Range in Excel
To convert an Excel table back into a standard range of cells, follow these steps:
- Select any cell within the table.
- Go to the “Table Design” tab.
- Click on the “Convert to Range” option.
- Confirm the action by clicking “Yes.”
How to Merge Tables in Excel
Merging tables in Excel is like putting two puzzles together to make a bigger picture. Imagine you have two separate lists of items, and you want to combine them into one big list. That’s what merging tables in Excel is all about.
- Identify the Tables: First, you need to have two separate tables in Excel that you want to merge. Each table could represent different types of data or information.
- Select and Copy: Next, select the entire table you want to merge into another. Copy it by pressing “Ctrl + C” or right-clicking and choosing “Copy.”
- Paste Special: Now, go to the location where you want to merge the tables. Right-click and choose “Paste Special.” You’ll see options like “Paste Values” or “Paste Link.” Choose the one that suits your needs.
- Adjustment: Excel will merge the tables based on your selection. You might need to adjust the layout or formatting to make everything look neat and organized.
- Review and Edit: Finally, review the merged table to ensure all the data is correctly combined. You can edit or make further adjustments as needed.
How to Combine Tables in Excel
Combining tables in Excel is like creating a bigger team by bringing together different groups of people with unique skills. Similarly, you’re combining different sets of data to create a comprehensive dataset in Excel.
- Prepare the Tables: Start with having two or more tables containing related information. These tables may have similar columns or fields.
- Power Query: Excel offers a powerful tool called “Power Query” to combine tables seamlessly. Go to the “Data” tab and click on “Get Data” > “Combine Queries” > “Merge.”
- Merge Options: Choose the tables you want to combine and specify the matching columns or fields. Excel will automatically merge the tables based on your criteria.
- Adjustment: After merging, you may need to adjust the combined table’s layout or structure to ensure clarity and coherence.
- Review and Refine: Take a moment to review the combined table and make any necessary refinements or edits. Ensure that all the data is correctly integrated and presented.
FAQ
Can I apply formulas within Excel tables?
Yes, Excel tables support the use of formulas, allowing you to perform calculations and manipulate data dynamically.
Are there any limitations to the size of an Excel table?
While Excel tables can accommodate large datasets, there may be performance implications when working with extremely large tables, requiring users to optimize their workbooks for efficiency.
Can I customize the appearance of an Excel table?
Yes, Excel table offer various customization options, including formatting styles, color schemes, and font choices, allowing users to tailor the appearance to their preferences.
Can I use a slicer in Excel table?
Yes, you can use slicers with Excel tables. Slicers are a great tool for filtering data visually in Excel, and they work well with tables. Here’s how you can use a slicer with an Excel table:
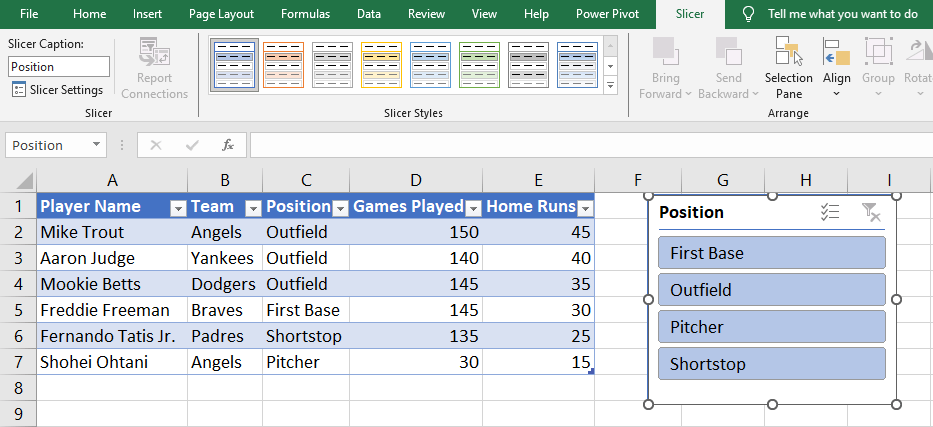
- First, make sure you have your data organized in an Excel table.
- Click anywhere inside your table to select it.
- Go to the “Insert” tab on the Excel ribbon.
- In the “Tables” group, click on “Slicer.”
- A dialog box will appear showing all the column headers from your table.
- Select the column(s) you want to create slicers for and click “OK.”
- Excel will insert slicer(s) on the worksheet based on your selection.
Conclusion
Excel tables are invaluable for organizing, analyzing, and visualizing data efficiently. By leveraging its features for structured formatting, dynamic range management, and powerful data manipulation, you can streamline your workflows and gain deeper insights from any dataset.